click to play video
DID will cover WBR’s Defense Logistics conference on Dec. 3-5 in Alexandria, VA. The following entry gives a quick sense of the massive scale of US military logistics, for background context. It aims to provide orders of magnitude and key datapoints, rather than extremely precise and detailed data.
The US Department of Defense is well known as one of the largest organizations worldwide, with its sprawling physical footprint across the world and massive needs for storage, transportation, and distribution. How big of a logistics user and provider do they turn out to be? Let’s find out.
Resources: People and Dollars puts US Military Logistics in a Scale of Its Own
The US military, thanks to a significant contribution from its National Guard and Reserves, can count on close to 180,000 people for logistics and transportation missions. As a point of reference, this is about the size of the UK’s entire armed forces!
DoD transportation costs amount to an average of about $1.5B/year excluding war spending (OCO) but reached $7.3B in FY 2012 with OCO included, or more than 15% of the entire defense budget of a country like France. That number will remain very high until the drawdown from Afghanistan is complete by the end of 2014.
TRANSCOM
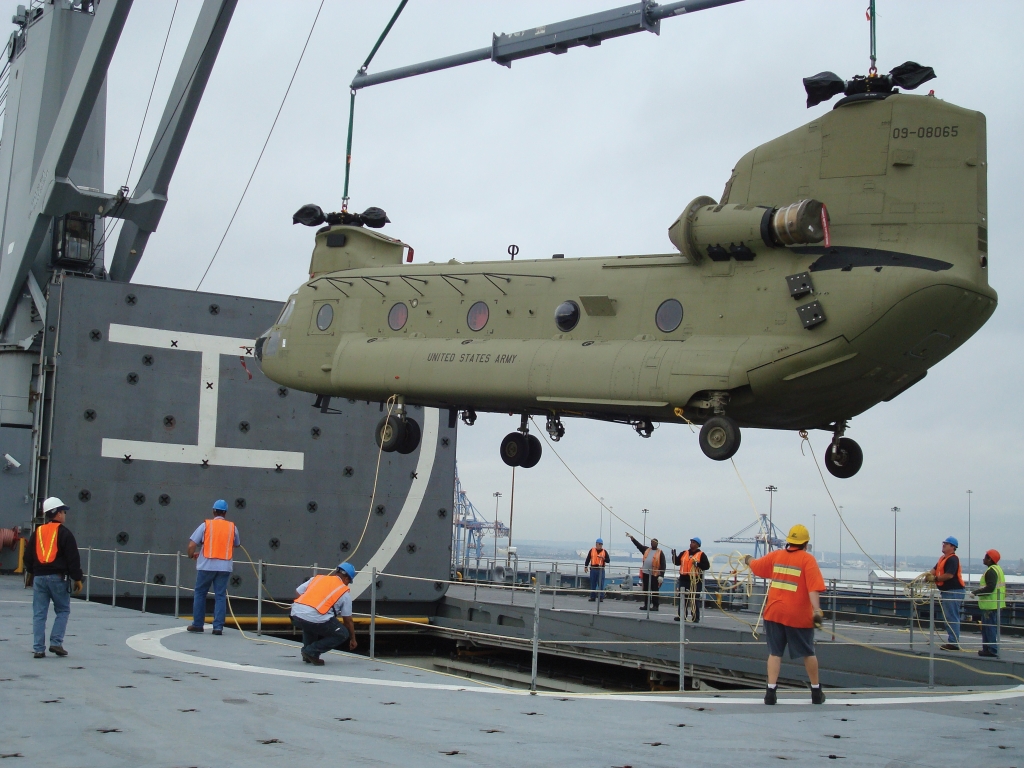
(click to view full)
US Transportation Command (USTRANSCOM) is “a unified, functional combatant command which provides support to the 8 other combatant commands, the military services, defense agencies and other government organizations.” First established in 1987, by 2003 they were designated as DoD’s Distribution Process Owner, adding a supply responsibility on top of transportation. TRANSCOM is represented in the services by the following organizations: Air Mobility Command (AMC) within the Air Force, Military Sealift Command (MSC) within the Navy, Surface Deployment and Distribution Command (SSDC) within the Army, which are supplemented by a few smaller joint offices.
* Personnel: about 150,000 people: 33% active duty / 53% reserve and guard / 17% civilian.
* Transportation Working Capital Fund: $13.7B expense in FY2012.
AMC
* 134,000 people, two thirds of them coming from the Guard and Reserve. That makes AMC by far the largest component of TRANSCOM, which probably explains why that command is always headed by a USAF general.
* Aircraft inventory (as of 2013, on the way down): 454 tankers (59 KC–10s, 394 KC–135s), 302 strategic airlift aircraft (79 C-5s and 223 C-17s), ~340 tactical airlift aircraft (C-130s).
MSC
* 9,800 people, 88% civilian.
* Ships operated: about 110. These are noncombattant ships such as dry cargo ships and oilers operated by civilian crews.
SDDC
* 3,000 people, 71% civilian.
Defense Logistics Agency
DLA handles the flow of essential consumables from food to water to fuel, as well as medical supplies, uniforms and other items.
* About 27,000 people: 98% civilian, 2% military.
* Supply chain management expenses: about $24B/year.
* Energy management expenses: about $20B/year.
Storing, Shipping, Distributing: What’s at Stake
click to play video
* USTRANSCOM airlift: 84,906 sorties; 31,181 missions; 1.9 million passengers; 659,176 short tons (598K metric tons) of cargo (FY2012).
* USTRANSCOM aerial refueling: 20,870 sorties; 1.26 billion pounds of fuel offloaded; 83,169 receivers (FY2012).
* USTRANSCOM land transportation: SDDC moved 14.6 million square feet (~1.35 million square meters) of cargo in FY2012.
* USTRANSCOM sealift: MSC moved 502,000 measurement tons (about 568,000 cubic meters) of cargo, 4.1 million square feet of dry cargo, 37,712 pallets of ordnance, and 46 million barrels of fuel in FY2012.
* USTRANSCOM transport handled by private contractors: 88% of continental U.S. land transport, 50% of global air movement, and 64% of global sealift.
* AMC airdrops in Afghanistan: almost 76 million pounds (~38K short tons / 34.5K metric tons) at peak in 2011. At the time 27,000 troops in 43 forward operating bases in the country were supplied solely by air.
* Airdrops can be performed from as low as 150 feet (46m) in the case of Low-Cost, Low-Altitude (LCLA) drops, to as high as 25,000 feet (7,600m) thanks to JPADS.
* Cargo moved through the Northern Distribution Network (NDN) during FY2012: 49,000 twenty-foot equivalent unit (TEU) containers or 291,000 short tons (264K metric tons). Cost of losing access to the PAKGLOC (i.e. driving on Pakistan’s roads) between Nov. 2011 and the summer 2012: at least ~$100M/mo. Peak backlog at the Karachi port in Pakistan at the end of 2012: about 7,000 containers.
* 87% of the cargo coming out of Afghanistan is handled by SDDC, since international commercial ocean liner and multimodal transportation services are increasingly booked through a recently-created Centralized Booking Office within SDDC.
* Consumable items handled by DLA: 5.2 million references, from repair parts to medical supplies to meals to uniforms.
* Storage space used by DLA: about 119 million cubic feet as of FY13 (51% covered, 46.5% open space, 2.5% specialized) across 26 depots.
Additional Readings & Sources
* USTRANSCOM – 2012 annual report [PDF]
* MSC – FY 2012 annual report [PDF] and 2013-18 Strategic Plan [PDF]
* SDDC – 2012 almanac
* DoD Comptroller – Operations & Maintenance overview FY2013 | FY2014 [PDF]
* DoD Comptroller – Defense Working Capital Fund FY14 [PDF]
* House Armed Services Committee (2012) – Assessing Mobility Airlift Capabilities [PDF].
* GAO (2012) – Assessment of DoD’s 2010 Mobility Capabilities and Requirements Study 2016 (MCRS-16)
* LMI (2008) – Transportation working capital fund study [PDF]
* Air Force Magazine – USAF Almanac 2013 [PDF]
* DID – Joint Logistics Panelists Agree to Shed Weight
* DID – Program Commonalities Good; Long Term Contracts Hard to Pull Off Domestically
* DID – US Defense Logistics Undersecretary Can’t Fake Enthusiasm